MCH Group at a glance
MCH Group is committed to maintaining its leading role in the exhibition and event sector. Our strategic goal is to create added value by integrating ESG aspects into our value creation. (ESG: Environmental. Social. Governance.)
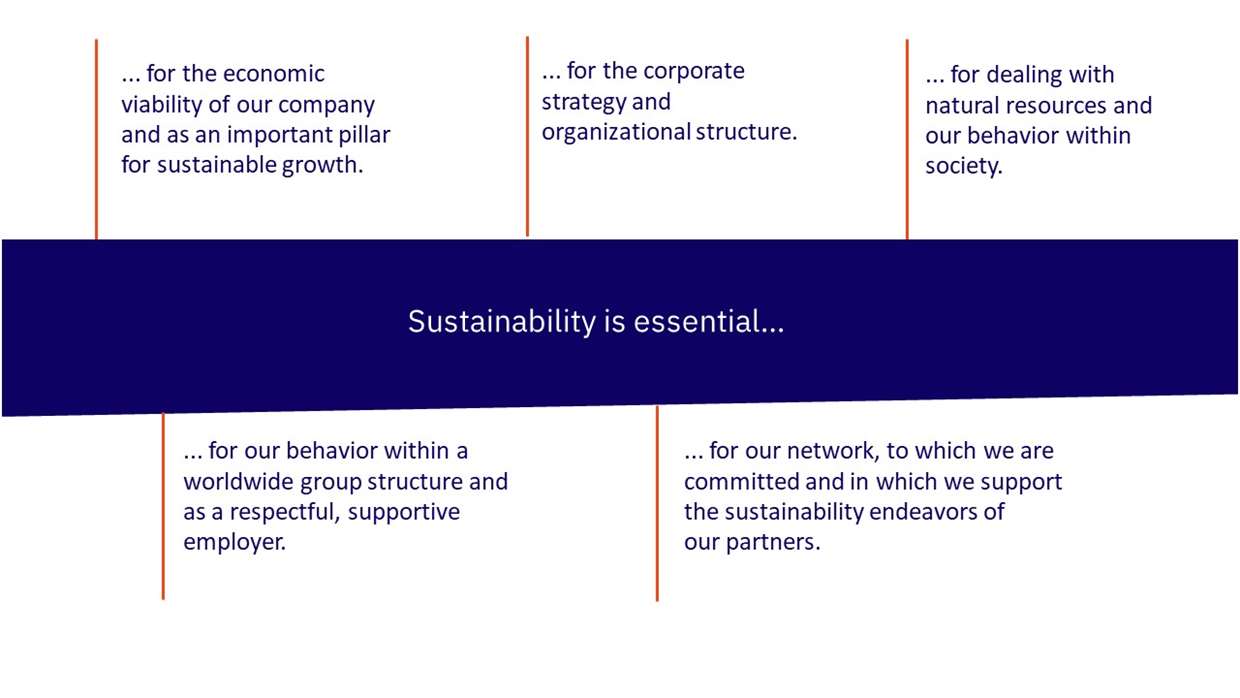
Sustainability entails responsibility towards our stakeholders and shareholders. We innovate and continuously develop both ourselves and our business model. Above all, we set ourselves ambitious but attainable goals. These are commensurate with our strategy of sustainable growth and expansion. At the same time, we aim to meet the climate targets (Paris 2050, COP28) and comply with the legislation.
Networking different competencies to achieve unique, customer-oriented solutions
MCH Group, with its value chain, provides a very broad and variable range of services in physical and digital formats for a variety of industries (exhibitions such as Art Basel) together with bespoke offerings in all areas of experience marketing (Expomobilia, MC2, MCH Global). By networking its different competencies, the group is able to create unique, customer-oriented solutions.
Results 2023
98.62 %
of the electricity consumed at the Swiss locations is renewable
100 %
of emissions (Scope 1, Scope 2) at all MCH Group locations worldwide have been calculated for 2023
100 %
reusability is guaranteed by Expomobilia's expo design system (stand construction) in certified oak
34 %/66 %
proportion of women to men in the company
No. 1
global show for the international art market
Introduced
Supplier Code of Conduct
GRI.SBTi.
TCFD.CDP
Frameworks, standards, ratings 2023
Awards
MC2 USA: Experience Design & Technology Awards in 2023.
Expomobilia pavilions at the World Expo in Dubai.
We create added value
Key figures 2023
- EMISSIONS
Scope 1 Direct emissions:
Direct greenhouse gas emissions come from sources that are owned or controlled by the company, e.g. emissions from heating systems, the vehicle fleet, etc.
Scope 2 Indirect emissions:
Scope 2 comprises the greenhouse gas emissions from purchased electricity consumed by the company.
Location-based (emission factor):
This approach quantifies emissions on the basis of activity data and local or national grid factors, i.e. the average emission factors for a specific geographical region.
Market-based (emission factor):
Market-based figures refer to the emission factors of the electricity supplier or an individual electricity product.